A Team Project / Analysis of Traffic Accident Data
Project Purpose
We chose to analyze historical vehicle accident data to better understand when, where, and why accidents occur in the U.S.
We asked which states ranked highest in accidents. We then wanted to know when they occurred, (i.e. month, time, day, year).
We wondered if accidents increase with heat and humidity so we looked at that data next, and then what the weather was like at the time of accidents.
The data answered all of our questions and as a bonus other interesting facts were revealed as well
Data Clean-up
The data file came from Kaggle.com.
The original data set contained 2.25 million historical records and was too large to read into a jupyter notebook.
The first step was to decide what attributes to use in our analysis. Data that was not pertinent to our analysis was omitted from the original dataset.
Still too large, to read-in, we broke the data set up into four csv files. Once read-in, we concatenated the files for use in our analysis.
Data Analysis
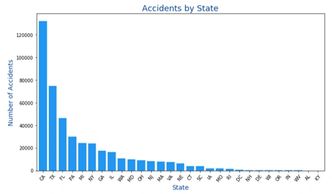
To answer the first question, we used data from the location file. We retrieved the number of accidents from each state listed.
Next, we used the date_time file to answer the questions of month, time of day, day, and year accidents occurred. To do this, we first extracted the day(int), day(string), month and year from the time stamp and then used Python and Excel to bin and chart the results.
Analysis Results
Accidents by State
Accidents by State
Accidents by State

California had by far the most car accidents.
The top ten states are:
California - 132,185
Texas - 74,796
Florida - 46,347
Pennsylvania - 29,872
Michigan - 24,276
New York - 24,059
Georgia - 17,299
Illinois - 16,453
Washington - 10,710
Maryland - 9,836
Accidents by Month
Accidents by State
Accidents by State

We used Excel to bin dates and to create this chart.
The full data points are as follows:
August - 31,506
September - 38,845
October - 38,369
November - 39,555
December - 46,358
January - 38,948
February - 40,306
March - 35,296
April - 38,431
May - 34,609
June - 24,779
July - 31,295
Accidents by Day
Accidents by State
Temperature at Time of Accident

There was little variance between weekdays.
As seen, and expected their are fewer accidents on the weekend.
Here are the stats:
Sunday - 24,110
Monday - 74,167
Tuesday - 79,108
Wednesday -77,675
Thursday - 77,853
Friday - 78,590
Saturday- 27,494
Temperature at Time of Accident
Temperature at Time of Accident
Temperature at Time of Accident

We used Excel to bin temperatures and to create this chart.
Here is the supporting data:
-13° to 32° - 22964
50° - 68,213
60° - 68,855
70° - 101,865
80° - 87,293
90° - 65,880
100° - 13,344
110° - 124° - 700
Humidity at Time of Accident
Temperature at Time of Accident
Humidity at Time of Accident

Again, we used Excel to bin temperatures and to create this chart.
As seen, the number of accidents increase as humidity levels rise.
Here is the supporting data:
10% - 1260
20% - 7679
30% - 18,333
40% - 32,970
50% - 51,199
60% - 62,487
70% - 66,017
80% - 63,377
90% - 70,993
100% - 54,222
Weather Condition
Temperature at Time of Accident
Humidity at Time of Accident

This bubble chart created in Tableau
explains that most accidents occur when the weather condition is clear.
Here are the top ten data points:
Clear - 175,342
Overcast - 71,974
Mostly Cloudy - 39,536
Partly Cloudy - 40,311
Light Rain - 19,250
Haze - 4,587
Rain - 4,045
Light Snow - 3,845
Fog - 1,616
Heavy Rain - 1,245
Time Accidents Occurred

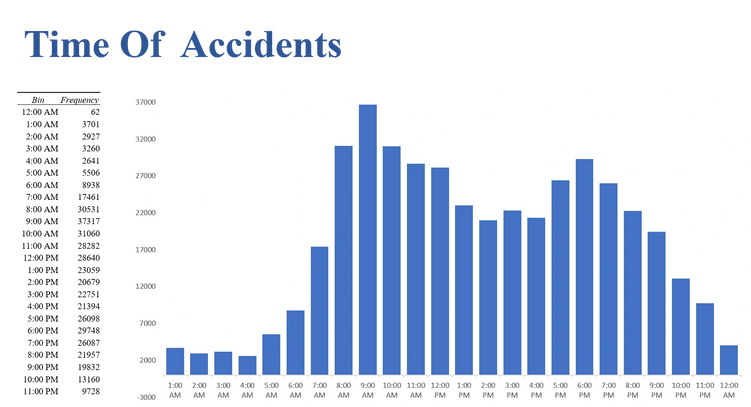
Not surprising, accidents most occurred during rush our traffic
Interesting Findings
Accident Side of Road
Accident Side of Road
Accident Side of Road

81.6% of accidents occurred on the right side of the road
Popular Street
Accident Side of Road
Accident Side of Road

Main street occurred four times in the top 6:
Main Street = 1,074 accidents
Westheimer Road = 562 accidents
N. Main Street = 506 accidents
Airport Blvd. = 435 accidents
W. Main Street = 386 accidents
S. Main Street = 369 accidents
Summary
In summary, the data, or lack of data in the dataset distorted the results. Since several northern states were missing from the dataset, southern warm climate data skewed the weather condition, temperature, and humidity analysis.
Additionally, there was no one full year of complete data. To capture 12 months of consecutive data, we had to use the last six months of 2016 and the first six months of 2017.
Having more time would have allowed us to source a more complete dataset that included demographic data points.
Post Mortem
Problems arose from the start. The data file was too large for Jupyter or GitHub. There were four years of data in the set.
Next we found that there was no full year of data and not all states were represented. In hindsight we should have chosen a different dataset but was too deep into it. We could not do anything about the states, we were able to extract a full year of data using the second half of 2016 and first half of 2017.
If we would have had more time, we may have found a dataset complete with all states and years. Also data such as age and sex of driver would be a good compliment.
The Team
Our team is comprised of 4 students enrolled in the Vanderbilt University Data Analytics certificate program. This boot camp is a fast paced agile environment. the curriculum can be found here: https://bootcamps.vanderbilt.edu/data/
Carrie McDowell - Team Lead
Amanda McCreary
Jack Cook
Nick Pierce
Copyright © 2020 Splynters - All Rights Reserved.